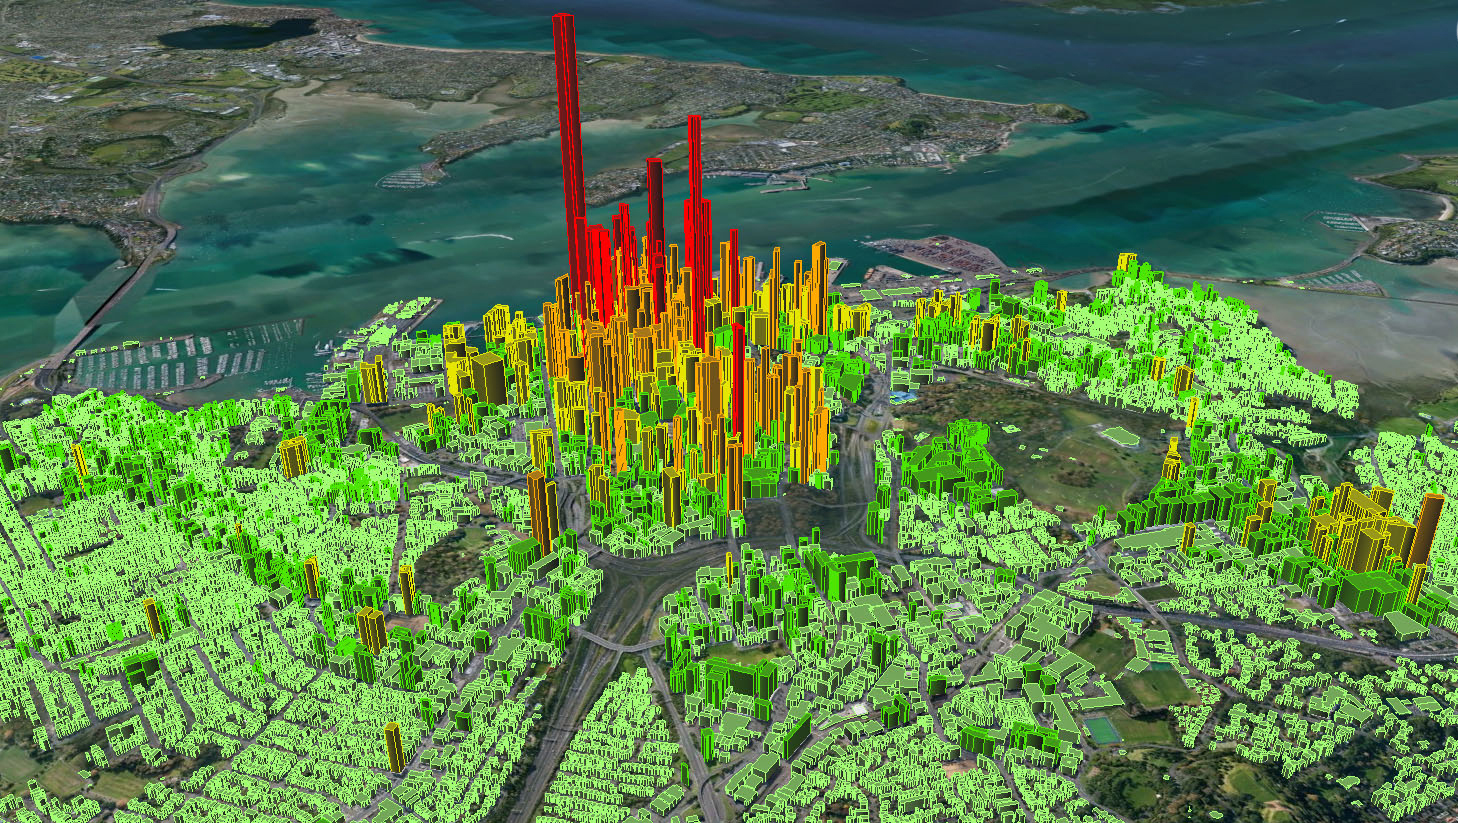
Catchies is a visualization we created for Auckland Transport as part of a study of walking catchments around busway, ferry, and train stops in Auckland, New Zealand. The visualization features a web map that displays all the 1-km walking catchments in question, along with their 1-km flying catchments. The walking catchments are color-coded by one of several selectable indicators, such as population ratio, the ratio of the population in the walking catchment to the population in the flying catchment.
Using Catchies, Auckland Transport could quickly compare catchments across several different quality measures and then prioritize ones for upgrade.
