We distil data into insights for decision makers. How many jobs can this suburb reach by public transport in 30 minutes? Where can housing development go, once flood risk and zoning are accounted for?
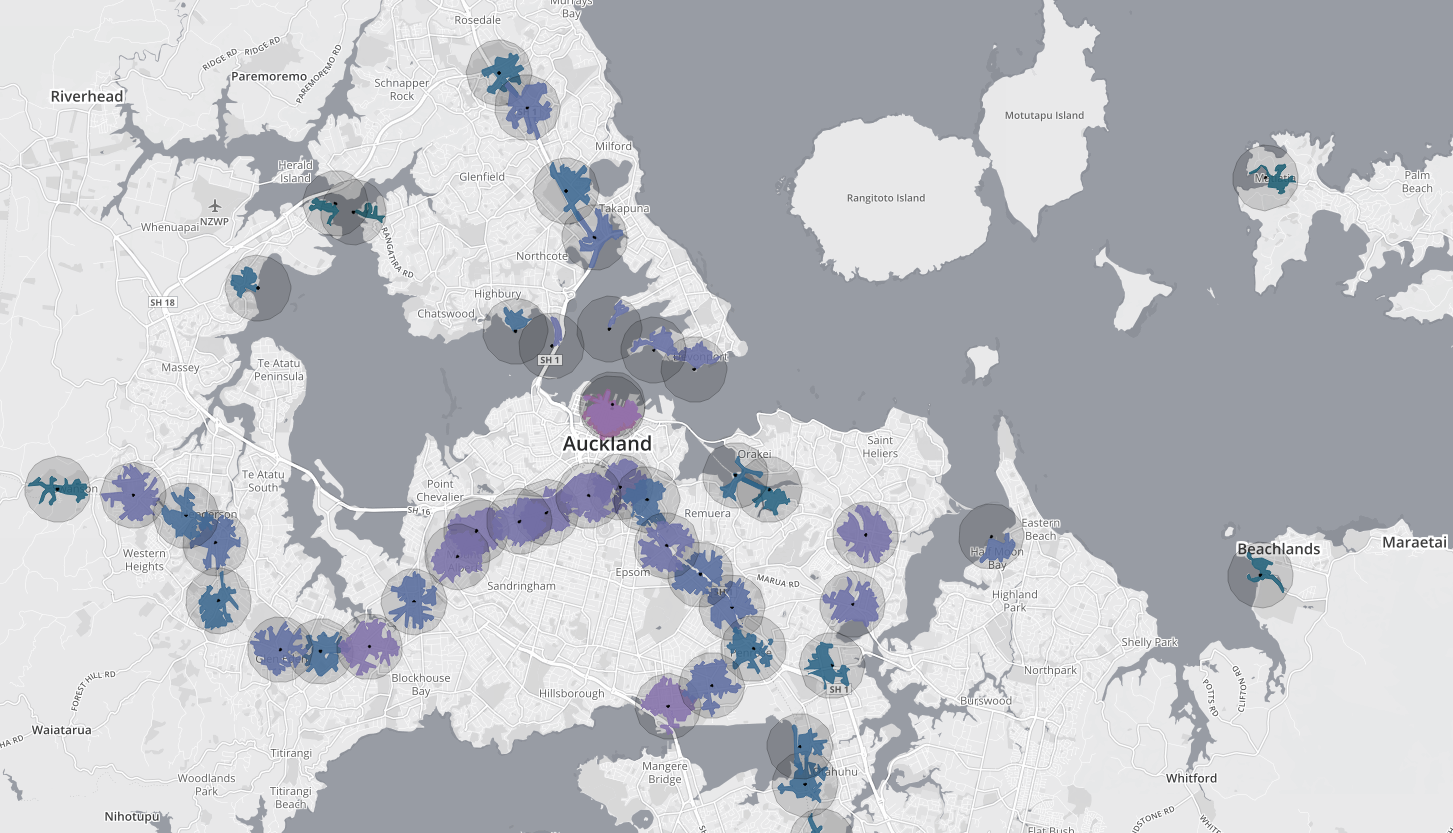
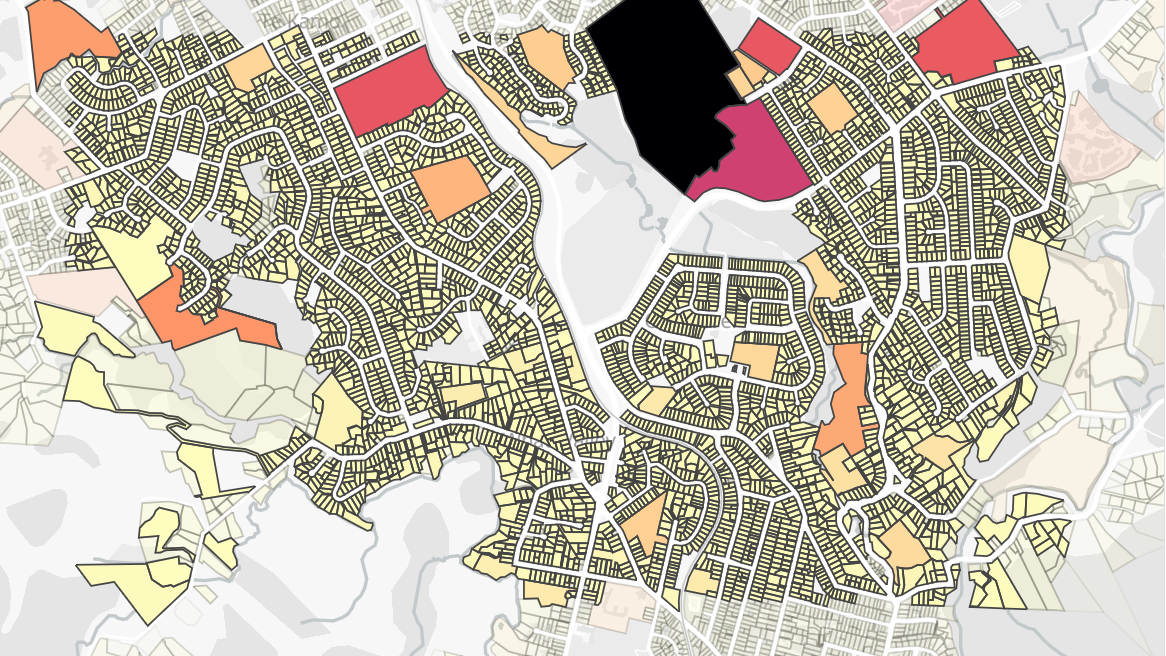
Answering questions like these means working where data analysis, data visualisation and software development meet: finding the patterns, testing the assumptions, and cutting messy transport, land-use and demographic data down to what matters. Most of what we're asked is about place, so geospatial analysis runs through everything we do, from field data collection to accessibility modelling, automated pipelines and interactive maps.
An insight nobody understands changes nothing. So we build the map, the model or the web app that lets decision makers see the findings, poke at the evidence and trust what they find. When a question is worth asking twice, we build a tool instead of an answer.
Explore the Data Science portfolio here to see examples of our work.
Key areas
- Data collection, processing and automation
- Data analysis, including geospatial and access analysis
- Data visualisation, including mapping
- Forecasting, scenario and valuation models
- Web applications, dashboards and bespoke tools
Related Case Studies

Team
-
 Alex Raichev
Researcher and Developer -
 Theodore Heeringa
Planner